GainSight Visualization Artifacts
This directory contains visualization outputs from the GainSight profiler framework that demonstrate its capabilities for analyzing memory behavior across different architectures and workloads.
Overview
The three visualization images included here are outputs from Tableau's interactive visualization interface, presenting typical results produced by the GainSight profiler framework for representative machine learning workloads from MLPerf Inference and benchmarks from Polybench GPU. Each visualization provides unique insights into on-chip memory traffic and data lifetime patterns.
These images form the central part of our case study of using GainSight to analyze the applicability of gain cell RAM (GCRAM) as short-term on-chip memory devices for machine learning accelerators. The analysis focuses on the NVIDIA H100 GPU and a 256×256 systolic array architecture, which are representative of current and future machine learning accelerators.
You can access the interactive versions of these visualizations through https://gainsight.stanford.edu/visualization/. More detailed discussions about the included image artifacts and case studies are available within the preprint paper at: https://arxiv.org/abs/2504.14866.
GPU Cache Analysis Visualizations
GPU Overview Visualization (gpu_overview.png)

This visualization demonstrates GainSight's analysis of L1 and L2 cache behavior in an NVIDIA H100 GPU across various machine learning workloads. As described in the GPU experiments study:
- The left side presents scatter plots showing projected area and energy requirements for L1/L2 caches using different memory technologies (SRAM, silicon GCRAM, and hybrid GCRAM)
- The right side displays histograms of data lifetime distributions compared against retention times of Si-GCRAM (1ns) and Hybrid-GCRAM (10ns) technologies
- The visualization reveals a bifurcation of data lifetimes, where approximately 39.5% of L1 and 18.4% of L2 accesses have lifetimes under 1μs
This interactive visualization enables detailed analysis of how different workloads utilize cache memory, informing decisions about memory device selection and optimization.
Write Allocation Policy Impact (gpu_write_allocation.png)

This visualization examines how write allocation policies affect data lifetime distributions in GPU caches:
- The visualization compares write-allocate (left) versus no-write-allocate (right) policies
- Impact is shown separately for L1 (top) and L2 (bottom) caches
- The histograms demonstrate that no-write-allocate policies significantly reduce short-lived data entries, especially in L1 caches
- This analysis helps identify strategies to mitigate cache pollution issues, where data with minimal reuse displaces more useful entries
Systolic Array Analysis
SCALE-Sim Lifetime Distribution (scale_sim_lifetime.png)
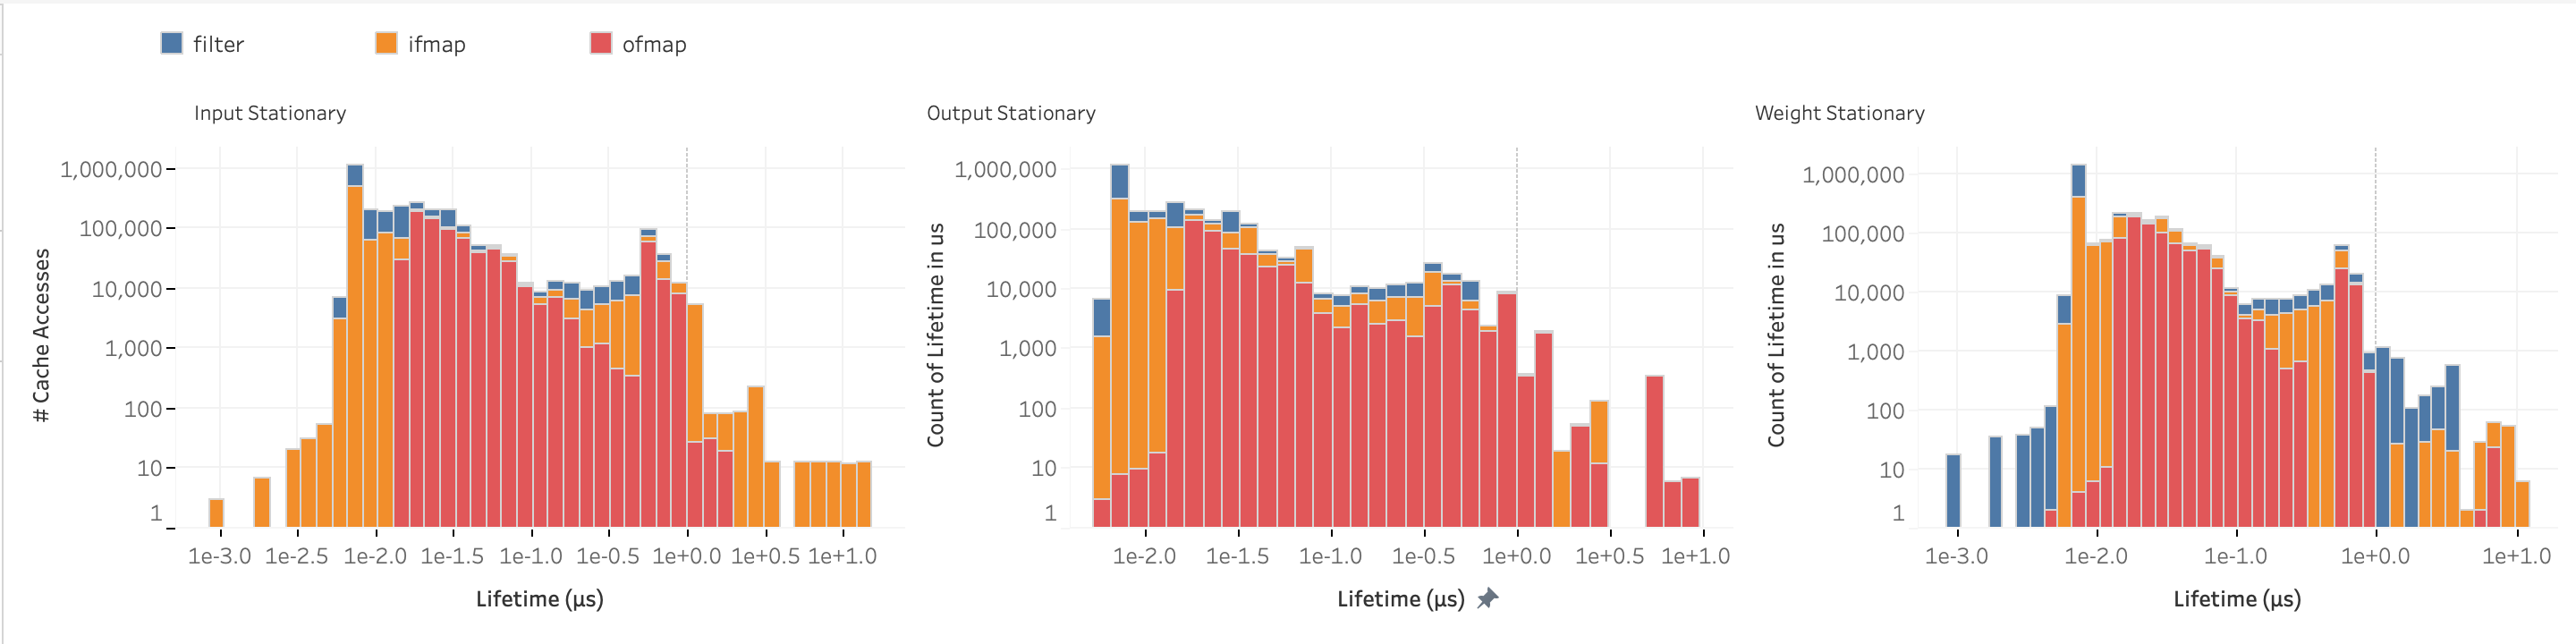
This visualization presents data lifetime distributions for ResNet-50 executed on a 256×256 systolic array under three different dataflows:
- Input stationary (
is), weight stationary (ws), and output stationary (os) dataflows are compared - Analysis shows that at least 79.01% of data accesses to input, output, and weight buffers have lifetimes below 1μs
- The bimodal distribution reveals distinct patterns for short-duration and extended-duration lifetimes
- This visualization highlights how dataflow primarily affects the maximum lifetime of stationary data
Interactive Features
All three images are generated through GainSight's Tableau-based interactive visualization interface, which provides:
- Filtering capabilities by workload, cache type, and memory device
- Customizable views to focus on specific metrics or memory regions
- Comparative analysis between different memory technologies and configurations
- Tools to explore the relationship between data lifetimes and architectural decisions
These visualizations represent just a subset of the analytical capabilities offered by the GainSight profiler framework, which enables researchers and architects to make informed decisions about memory hierarchies for machine learning accelerators.