GainSight Profiling Framework Organization
GainSight is a comprehensive profiling framework designed to analyze fine-grained memory access patterns and compute data lifetimes in domain-specific accelerators. It aims to answer the question: "For a given workload executed on a target hardware accelerator, what are the tangible benefits of replacing on-chip SRAM with emerging memory device arrays in terms of area and energy consumption?"
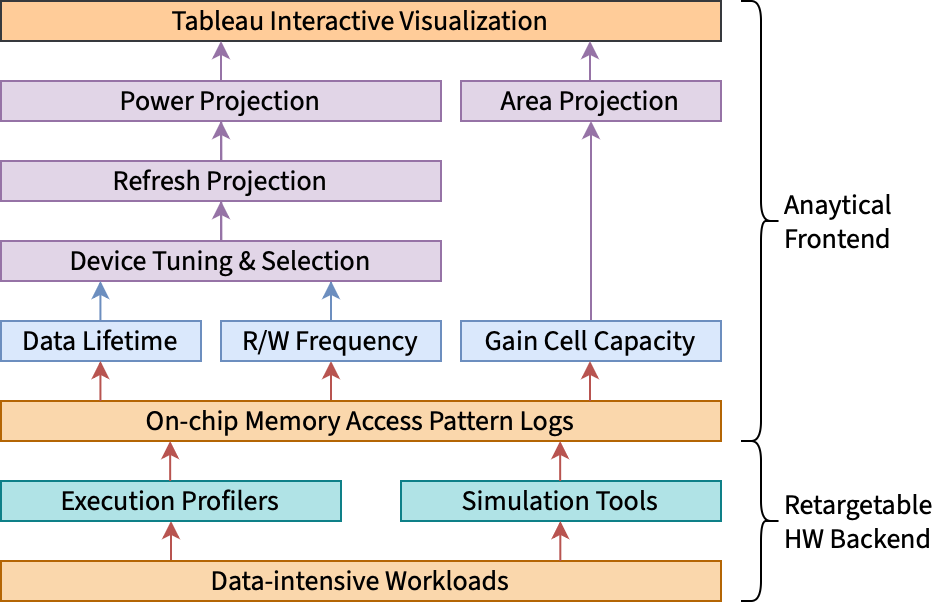
GainSight organized into two main components: a set of retargetable hardware backends and a flexible analytical frontend, as illustrated below.
Backend: Retargetable Hardware Profiling
The backend's primary function is to execute workloads on specific hardware architectural simulators and generate fine-grained, cycle-accurate memory access traces. Specific formats for these traces are found in https://gainsight.stanford.edu/data-formats.html, but they generally include detailed metadata such as address, access type (read/write), timing, size, and hit/miss status for each memory operation.
The two backends implemented in the current version of GainSight are:
- NVIDIA GPU Simulator: Cycle-accurate simulation of NVIDIA GPU workloads using a modified version of the Accel-Sim simulator, in particular the interface between the streaming multiprocessor (SM) and the two levels of local and shared memory caches. This simulator can model various GPU architectures from NVIDIA's Kepler to Hopper.
- Systolic Array Simulator: Extended SCALE-Sim-v to simulate DNN workloads (CNNs or Transformers) on systolic arrays. It generates memory traces for input, weight, and output on-chip buffers. This backend supports configurable dataflows, PE array dimensions, and buffer sizes, providing cycle-accurate simulations. DRAM accesses are treated as writes and SRAM accesses as reads for input/weight buffers (vice-versa for output buffers).
Separate pages in this documentation provide usage instructions for each backend. Please refer to the GainSight preprint paper for a detailed description of the backends, including their architecture and simulation capabilities.
This backend component is also designed to be extensible, given that any backend producing similar cycle-accurate memory access traces can be integrated into GainSight. The backend is responsible for generating the memory access traces, which are then processed by the frontend To handle architectural heterogeneity (e.g., GPU caches vs. systolic array scratchpads), GainSight uses the concept of memory "subpartitions," abstracting distinct memory components for independent analysis by the frontend.
Frontend: Analytical Processing and Visualization
The frontend processes the memory access traces generated by a backend to compute key statistics for each memory subpartition, including:
- Data lifetimes: Time between data creation (write) and its last use (last read before next write or end of trace), as defined in Section 3 of the paper.
- Read/write frequencies: Calculated by counting clock cycles with memory operations and normalizing by the total workload clock cycles.
- Capacity utilization: Determined by counting unique memory addresses accessed, scaled by the memory block size.
These statistics are correlated with memory device models to estimate retention requirements, area, and active energy consumption. In terms of the two short-term memory devices (fully silicon and silicon-oxide hybrid gain cell RAMs) considered in the initial GainSight release, the frontend correlation process involves:
- Using maximum write frequency to compute memory device retention times
- Aligning retention times with observed data lifetimes to estimate refresh cycle requirements
- Calculating active energy consumption based on read/write operations and required refreshes
- Estimating physical area based on capacity requirements
The frontend generates JSON reports summarizing these KPIs and supports interactive visualization using Tableau. The Tableau framework includes lifetime histograms, comparative scatter plots (area vs. energy), and interactive filtering to explore memory behavior and device trade-offs across workloads, architectures, and subpartitions.
Please refer to the GainSight preprint paper for a detailed description of gain cell RAMs, their unique device characteristics, and how these characteristics influence the overall organization of GainSight.
Workflow Overview
The overall GainSight workflow follows these steps:
- Trace Generation: Execute workloads on a chosen hardware backend (e.g., Accel-Sim for GPU, SCALE-Sim for systolic array) to produce detailed memory access traces, potentially using sampling techniques like PKA for efficiency.
- Trace Analysis: The frontend parses these traces, calculating data lifetimes, read/write frequencies, and capacity utilization for each defined memory subpartition.
- Device Correlation: Map the calculated statistics to specific memory device models (SRAM, Si-GCRAM, Hybrid-GCRAM) to project area and active energy requirements, considering factors like retention time and refresh cycles.
- Visualization: Load the resulting JSON data into the Tableau framework for interactive exploration of memory characteristics and device trade-offs, facilitating design space exploration and decision-making.
This modular organization allows GainSight to support a wide range of hardware backends and memory technologies, providing actionable insights for the design of next-generation AI accelerators.